10 Most Polluted Cities in the World
Data from IQAir’s 2024–25 World Air Quality Report and other reputable sources.
| Rank | City | Country | PM₂.₅ Annual Avg (µg/m³) |
|---|---|---|---|
| 1 | Byrnihat | India | 128.2 |
| 2 | Delhi | India | 108.3 |
| 3 | Karaganda | Kazakhstan | 104.8 |
| 4 | Mullanpur | India | 102.3 |
| 5 | Lahore | Pakistan | 102.1 |
| 6 | Faridabad | India | 101.2 |
| 7 | Dera Ismail Khan | Pakistan | 93.0 |
| 8 | N’Djamena | Chad | 91.8 |
| 9 | Loni | India | 91.7 |
| 10 | New Delhi | India | 91.6 |
1. Byrnihat, India
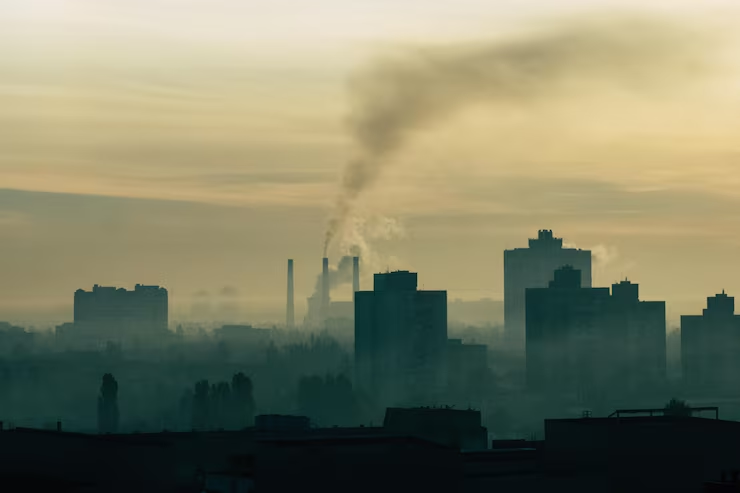
Recorded a staggering 128.2 µg/m³ average PM₂.₅—more than 25× the WHO guideline of 5 µg/m³. Located in northeastern India, heavily impacted by industrial emissions, construction dust, and biomass burning.
2. Delhi, India
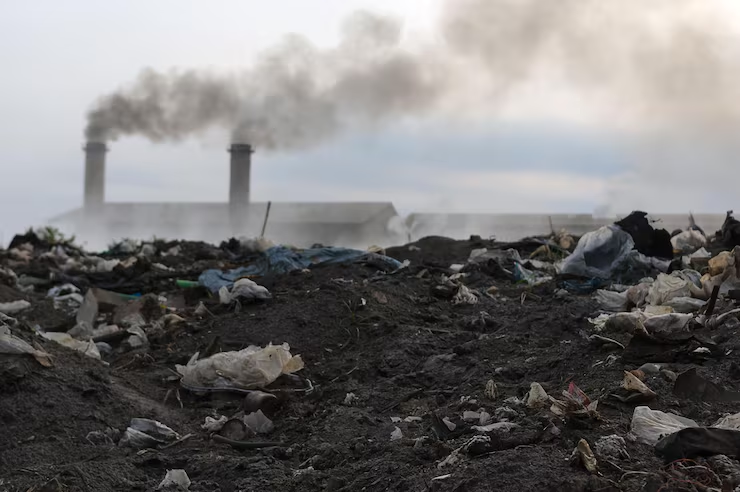
- Capital territory of over 30 million people.
- PM₂.₅ average 108.3 µg/m³—~18× above safe limits.
- Seasonal agricultural burning, industrial and vehicle emissions, landfill fires, and Diwali firecrackers drive pollution peaks.
- On November 18, 2024, Delhi’s 24-hour AQI reached 491 ("severe-plus")—hazardous to health.
- Residents often say: “Breathing the air in New Delhi is equivalent to smoking 45 cigarettes a day.”
- This aligns with past AQI spikes, which ranged from 25–30 cigarettes/day at AQI ~500 .
- Government declared a medical emergency, shut schools, halted flights, and installed smog towers (limited impact).
3. Karaganda, Kazakhstan
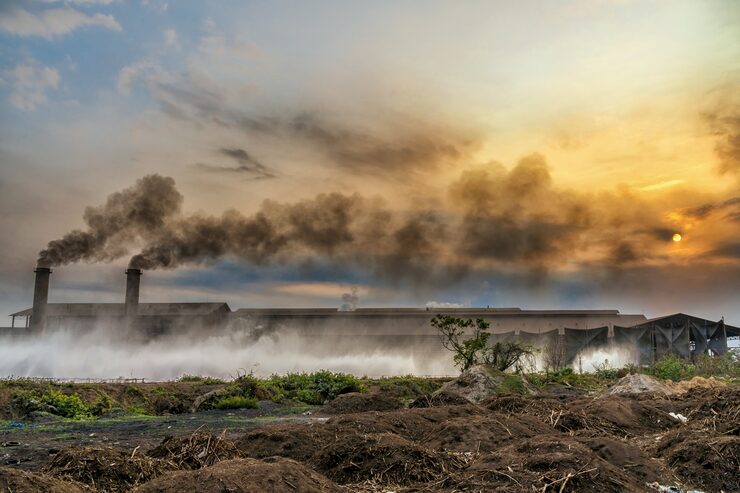
Annual average 104.8 µg/m³, driven by coal-fired power plants, metallurgical industry, and dust.
4. Mullanpur, India
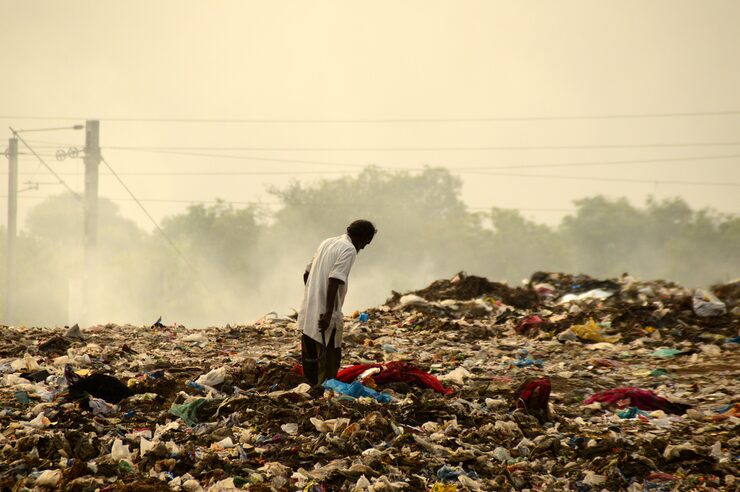
Recorded 102.3 µg/m³ PM₂.₅ in 2024, due to rapid industrial expansion and construction.
5. Lahore, Pakistan
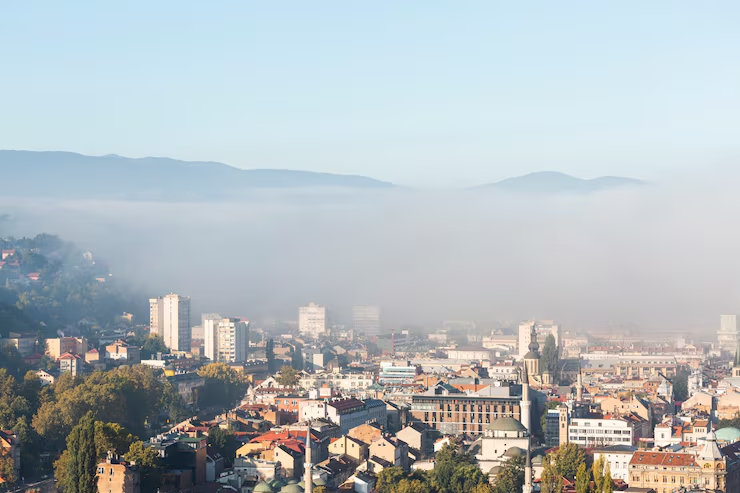
PM₂.₅ average 102.1 µg/m³, resulting from brick kiln emissions, crop-burning in Punjab, vehicle and industrial pollution. In November 2024, AQI soared past 1,000, with some areas exceeding 1,900, prompting mass closures and health warnings.
6. Faridabad, India
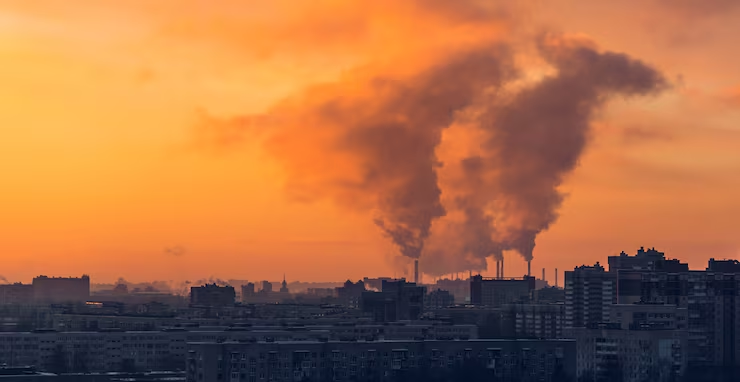
Close neighbor of Delhi, recorded 101.2 µg/m³, affected by industrial zones and power plants.
7. Dera Ismail Khan, Pakistan
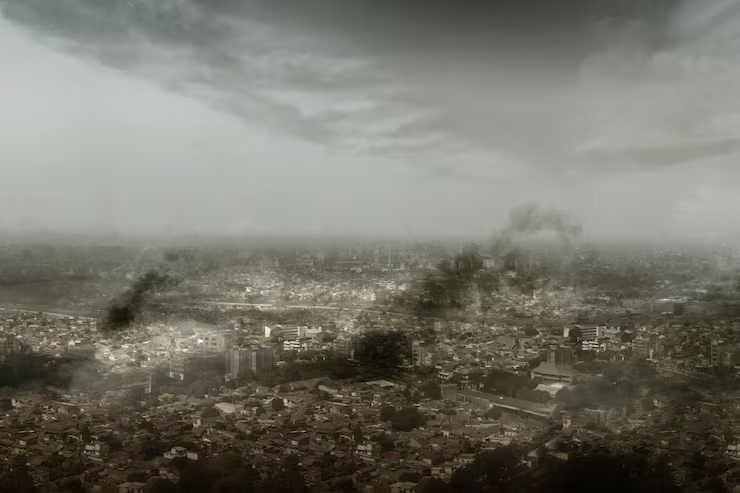
Annual average 93.0 µg/m³, influenced by nearby agriculture burning and desert dust.
8. N’Djamena, Chad
Average 91.8 µg/m³, making it the only African city in the top 10 capitals list.
9. Loni, India
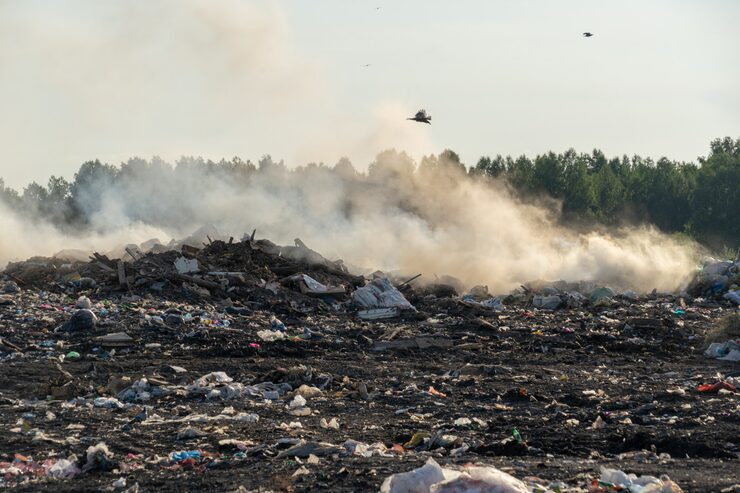
Average of 91.7 µg/m³, suffers heavy vehicle emissions and seasonal agricultural burning.
10. New Delhi, India
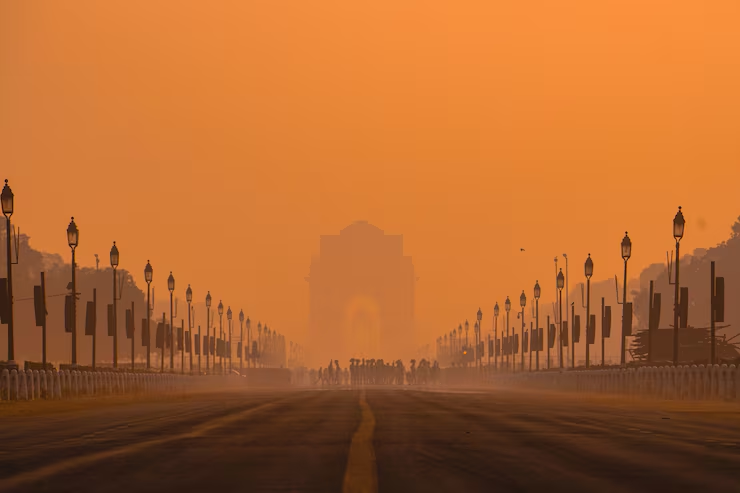
Slightly different figure from Delhi city center—91.6 µg/m³, making it among the worst capitals globally.
Health & Impact Summary
- Only ~17% of world cities meet the WHO standard of PM₂.₅ ≤ 5 µg/m³.
- Air pollution contributes to ~7 million deaths annually, including respiratory disease, stroke, cancer, mental health issues, and reduced life expectancy (up to 12 years in Delhi).
- South and Central Asia dominate the list: India and Pakistan alone account for 6 of the 9 worst cities globally.
These cities share several common pollution drivers: seasonal crop burning, fossil fuel dependence, industrial emissions, and vehicle exhaust. Many also face inadequate regulation and ineffective mitigation strategies—causing repeated medical crises, school closures, and pollution-related mortality.
Delhi stands out not only for its severe and persistent smog but also for health comparisons that bring the danger into stark relief—like equating daily exposure to 45 cigarettes.


